Swiss new-car market stays positive as used transactions see marginal growth
30 October 2023
Hans-Peter Annen, head of valuations and insights at Eurotax Switzerland, analyses how the Swiss new and used-car markets performed in the third quarter of 2023.
Switzerland’s new-car market recovery continued into the third quarter, with registration figures increasing further. In the year to date, the market grew 12.5% compared to the first nine months of 2022.
This growth can be attributed to continued improvements in vehicle deliveries, with backlogs caused by supply-chain issues easing. Additionally, the positivity comes despite the pressure of inflation and ongoing conflicts, highlighting the market’s stability.
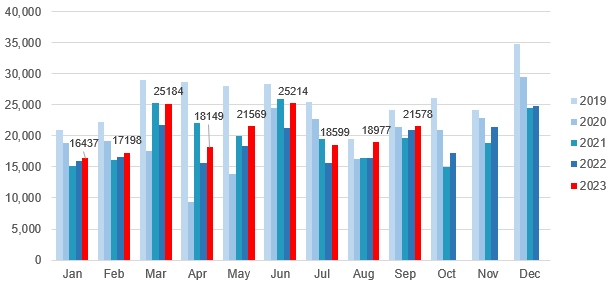
When compared with the first three quarters of 2019, prior to the COVID-19 pandemic, registrations were down 19.2%. In September, 21,578 new cars were registered, 3% more than in September 2022, but still 10.9% below the same month in 2019 (24,219).
Battery-electric vehicles (BEVs), full hybrids (HEVs), mild hybrids (MHEVs) and plug-in hybrids (PHEVs), reached a combined market share of 55.9% in the year to date. This was up from 49.4% when compared with the same period in 2022. BEVs alone claimed a year-to-date share of 19.8%, up from 16.3% across the same period in 2022.
Despite the ongoing economic challenges, this marginal registration recovery can be expected to continue in the coming months. However, this increase will not push the new-car market into pre-COVID-19 levels. Additionally, most of the deliveries delayed due to the supply-chain crisis have now likely been made.
New-car registrations by month, 2019-2023
Slight positivity
Characterised by high demand and low supply, Switzerland’s used-car market was booming until the autumn of 2022. But for some months now, supply across most vehicle age categories has exceeded pre-2020 levels, except for very young used cars. The number of used-car transactions has remained below the pre-COVID-19 point for some time.
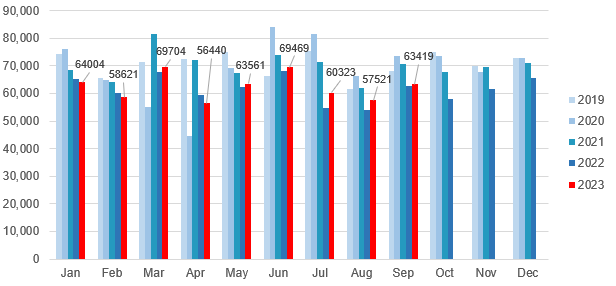
The first nine months of 2023 only marked marginal year-on-year growth, up 1.5%, accounting for 563,062 units. September also saw a small increase in transactions, up 1.3% (63,419 units) compared with the same month in 2022. This was to be expected given both July and August posted similar gains.
This slightly positive trend in used-car transactions can be expected to continue into the fourth quarter of 2023, as new-car registrations continue to slowly recover. As supplies of used cars reach a higher level, demand is now declining.
Used-car transactions by month, 2019-2023
Since the beginning of this year, the volume of used cars on offer has increased, almost reaching the levels recorded in February 2020 across all age groups. Only the supply of cars up to two years old is still around 20% lower than in that period.
Thanks to this overall good level of supply and weakening demand, the amount being offered for used models has come under pressure. Weakening demand has been met by higher supply, which is still scarce for very young models. As a result, high offer prices have fallen significantly since the beginning of the year.
Until the end of 2022, offer prices benefitted from the exceptional market situation. Since then, prices across all fuel types and age categories have fallen significantly. HEVs were an exception, weakening by only a small amount. BEVs were also able to benefit temporarily across all age classes. The powertrain technology still occupies second place among 12-month-old used vehicles, with HEVs leading the way.
*Since the beginning of 2022, the Federal Roads Office, ASTRA, has provided figures for changes of ownership. Before that, up to and including June 2022, ASTRA supplied raw data with all changes in the Swiss vehicle stock. The analysis of changes of ownership was carried out by Eurotax, partly with assumptions. The figures calculated in this way were approximately 3% higher than the values according to ASTRA’s evaluations from 2022 onwards. Therefore, the figures for 2022 are based on ASTRA data. The values up to and including 2021 are shown according to the previous method. This must be taken into account when comparing the figures for 2022 with previous years. Comparisons are therefore only possible to a very limited extent, if at all.