What is SAAR and why is it important?
26 May 2021

SAAR stands for seasonally-adjusted annualised rate, which is used to track vehicle-registration performance, giving a better representation of automotive market activity. Autovista24 Editor Phil Curry explains how SAAR is calculated and how it helps to determine how vehicle registrations are performing.
To get notifications for all the latest videos, you can subscribe for free to the Autovista24 YouTube channel.
Transcript – What is SAAR?

I’m Autovista24 Editor Phil Curry here with another entry into our automotive ‘What Is?’ series. SAAR stands for seasonally-adjusted annualized rate as a way of working out how vehicle registrations, be a new car or used car are performing in relation to typical market trends.
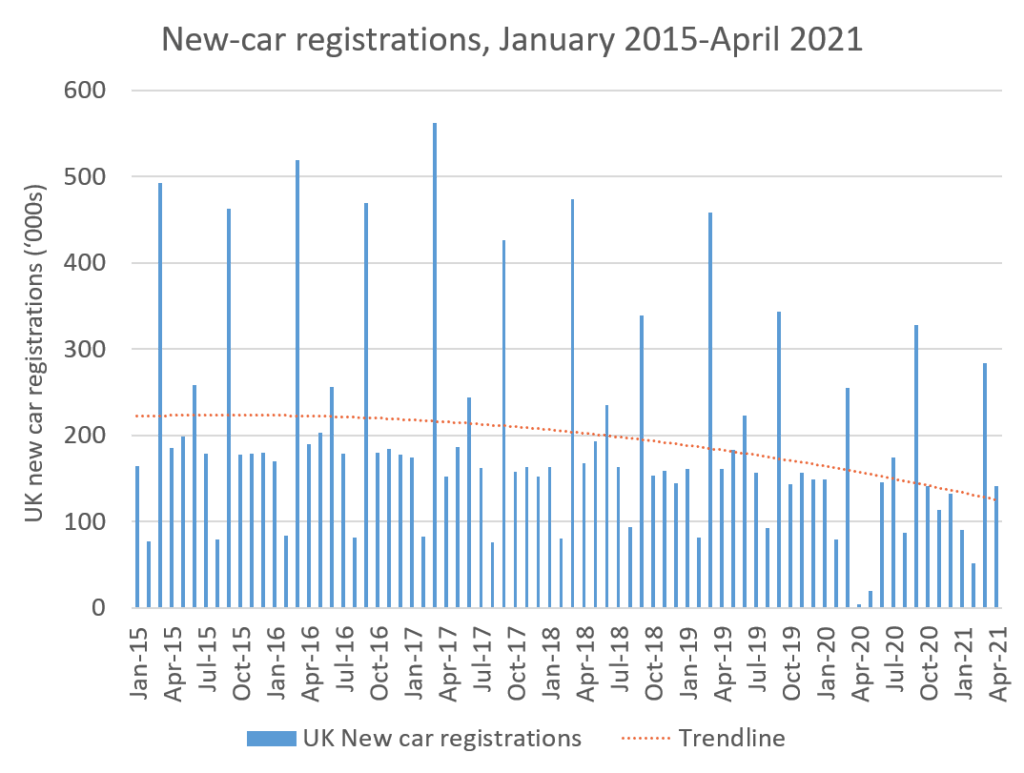
Traditional registration figures compare each month to the same period the year before, with a year to date tracking the performance so far.

As we can see here this leaves us with a lot of lines that don’t really say anything other than how the market is doing at that point in time. Registrations may be eight percent up in a month for example, but what does that really mean?
SAAR provides an alternative. By breaking down the monthly figures as a percentage of the final year total and in working out an average based on an extended time period we can see more clearly how the market is doing. Taking that average percentage we can work out what the likely total volume of cars sold in the year will be based on one month’s figures or a period of figures as we wish. This means that each month we have a total number of cars registered and moreover, can calculate the annualized rate i.e. the SAAR.
SAAR example
For example in one country June may represent four percent of all cars registered in the year based on an average between 2009 and 2017. Therefore, if a hundred thousand new cars have registered in that month the SAAR would suggest that the yearly total would be 2.5 million vehicles. If the average for July is three percent and 80,000 vehicles have registered the SAAR will suggest that 2.67 million vehicles will be registered in that year. We can therefore see that despite the lower volume the market performed better in July given the monthly increase in the SAAR.

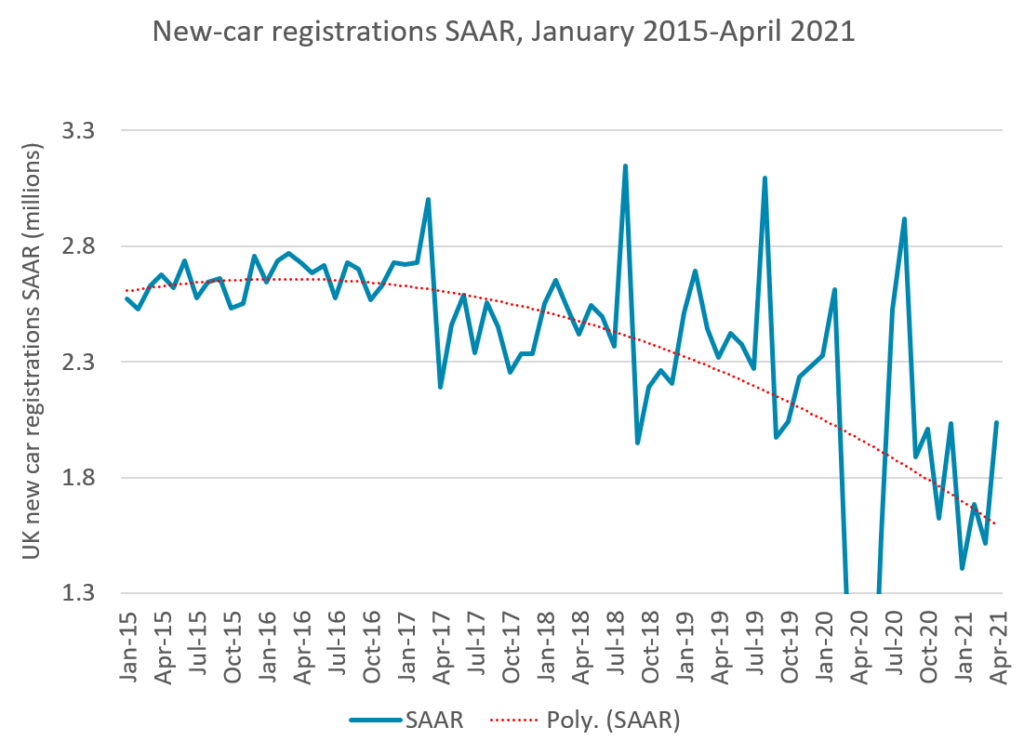
If we look at this graph which tracks the site in the UK new car market from January 2015 to May 2021 we can see a more meaningful path of how the market has performed.
Here the average percentages are taken from between 2009 and 2017, disregarding the market distortions of 2018 to 2020 because of WLTP and Covid-19. While the raw registration data shows the peaks and troughs, the SAAR shows a path of decline with various spikes dependent on political and market impacts. So, while April new car registrations were exponentially up against the same month in 2020, due to the impact of the Covid-19 pandemic we can clearly see that the industry is still tracking much lower than 2019 the last year of normality.
How SAAR helps
The SAAR aids in the development of forecasts for yearly sales activity in various European markets and adds additional credibility to the figures by allowing us to track underlying demand in each market based on a seasonally adjusted basis.

You can subscribe to the Autovista24 YouTube channel to ensure you do not miss out any of our other topical videos including future entries in our ‘What Is?’ series. Also, make sure to sign up for the Autovista24 daily email newsletter. Details are on screen. Thanks for watching.