
WLTP Focus: Understanding disparities in WLTP and NEDC-correlated data
09 October 2018

9 October 2018
Registration taxes are at the crux of the emissions debate. The new WLTP testing procedure has had a massive impact on CO2 emissions data and the disparity between the WLTP, NEDC-correlated, and old NEDC data has further complicated the issue. So what does it all mean?
Autovista Group analysis reveals that the average deviation between WLTP and NEDC-correlated (NEDC-c) CO2 emissions figures now stands at 21%. This is slightly lower than we reported in March, when WLTP CO2 emissions figures were averaging 25% higher than NEDC-c values. Autovista calculates the difference between NEDC-c and WLTP emissions figures in the new car registrations data provided by a national motor authority.
Figure 1: WLTP and NEDC-c emissions figures, CO2 g/km
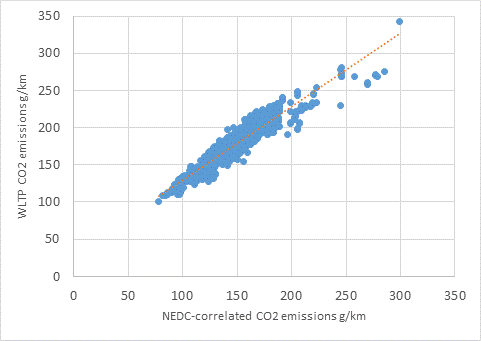 There are numerous NEDC-c figures depending on the make, model, cubic capacity (cc), fuel type, transmission, and body style of each car but there are countless more WLTP figures because of the impact of options fitted to registered cars. NEDC-c values of the WLTP-compliant cars registered in the market in question currently range from 78g CO2/km to 299g/km and WLTP figures range from 101g CO2/km to 343g/km. The average mathematical deviation of 21% is calculated from the emissions figures for individually registered cars and aligns with the expectations outlined in a European Commission study published early in 2018. This is a more accurate method than using manufacturers’ specifications, i.e. averaging the deviation of each model variant available on the market, which would not factor in volume weighting.
At a first glance at the scatterplot above, it appears that there is a linear correlation between WLTP and NEDC-c figures. The trend line even suggests this. However, the WLTP:NEDC-c ratio actually ranges from 0.94 to 1.40 (i.e. -6% to +40%) and will invariably continue to widen further as data for more models is released. Furthermore, although the deviation ranges from 0.94 to 1.4, our analysis has revealed that, paradoxically, lower emissions cars typically have higher deviations whereas some cars with high power output even record lower emissions figures under WLTP than NEDC-c. We refer to this phenomenon as the ′WLTP Power Paradox.’ The scatterplot below highlights this trend as you can see that the deviation diminishes the higher the NEDC-c emissions figure, as per the trend line.
Figure 2: NEDC-c emissions figures, CO2 g/km, and WLTP:NEDC-c deviation (%)
There are numerous NEDC-c figures depending on the make, model, cubic capacity (cc), fuel type, transmission, and body style of each car but there are countless more WLTP figures because of the impact of options fitted to registered cars. NEDC-c values of the WLTP-compliant cars registered in the market in question currently range from 78g CO2/km to 299g/km and WLTP figures range from 101g CO2/km to 343g/km. The average mathematical deviation of 21% is calculated from the emissions figures for individually registered cars and aligns with the expectations outlined in a European Commission study published early in 2018. This is a more accurate method than using manufacturers’ specifications, i.e. averaging the deviation of each model variant available on the market, which would not factor in volume weighting.
At a first glance at the scatterplot above, it appears that there is a linear correlation between WLTP and NEDC-c figures. The trend line even suggests this. However, the WLTP:NEDC-c ratio actually ranges from 0.94 to 1.40 (i.e. -6% to +40%) and will invariably continue to widen further as data for more models is released. Furthermore, although the deviation ranges from 0.94 to 1.4, our analysis has revealed that, paradoxically, lower emissions cars typically have higher deviations whereas some cars with high power output even record lower emissions figures under WLTP than NEDC-c. We refer to this phenomenon as the ′WLTP Power Paradox.’ The scatterplot below highlights this trend as you can see that the deviation diminishes the higher the NEDC-c emissions figure, as per the trend line.
Figure 2: NEDC-c emissions figures, CO2 g/km, and WLTP:NEDC-c deviation (%)
 The deviation varies between cars because the WLTP test cycle has a different energy demand to NEDC, and vehicles respond differently to the test requirements. Many cars are already subject to higher registration taxes in certain markets as their NEDC-c values (based upon the results of WLTP testing) are higher than the figures previously reported under NEDC testing. The increase is typically between 5%-10%, which opens up the possibility of thousands of buyers paying a tax penalty by stealth.
Plug-in hybrid models have been adversely affected as the effect of the fully-charged electric battery has been reduced, pushing crucial CO2 emissions figures above 50g/km. Consequently, some vehicle manufacturers who offer plug-in hybrid electric vehicles are halting sales of the models in Europe in the wake of the introduction of WLTP compliance on 1 September.
The impact on tax liabilities would be even greater if countries with emissions-based tax regimes switched to using WLTP emissions figures, given the higher deviation than between NEDC-c and NEDC figures. Autovista Group has conducted analysis that highlights the additional taxes that will be levied on new cars in the EU5 markets if they were to simply switch to using WLTP emissions figures.
The deviation varies between cars because the WLTP test cycle has a different energy demand to NEDC, and vehicles respond differently to the test requirements. Many cars are already subject to higher registration taxes in certain markets as their NEDC-c values (based upon the results of WLTP testing) are higher than the figures previously reported under NEDC testing. The increase is typically between 5%-10%, which opens up the possibility of thousands of buyers paying a tax penalty by stealth.
Plug-in hybrid models have been adversely affected as the effect of the fully-charged electric battery has been reduced, pushing crucial CO2 emissions figures above 50g/km. Consequently, some vehicle manufacturers who offer plug-in hybrid electric vehicles are halting sales of the models in Europe in the wake of the introduction of WLTP compliance on 1 September.
The impact on tax liabilities would be even greater if countries with emissions-based tax regimes switched to using WLTP emissions figures, given the higher deviation than between NEDC-c and NEDC figures. Autovista Group has conducted analysis that highlights the additional taxes that will be levied on new cars in the EU5 markets if they were to simply switch to using WLTP emissions figures.
There are numerous NEDC-c figures depending on the make, model, cubic capacity (cc), fuel type, transmission, and body style of each car but there are countless more WLTP figures because of the impact of options fitted to registered cars. NEDC-c values of the WLTP-compliant cars registered in the market in question currently range from 78g CO2/km to 299g/km and WLTP figures range from 101g CO2/km to 343g/km. The average mathematical deviation of 21% is calculated from the emissions figures for individually registered cars and aligns with the expectations outlined in a European Commission study published early in 2018. This is a more accurate method than using manufacturers’ specifications, i.e. averaging the deviation of each model variant available on the market, which would not factor in volume weighting.
At a first glance at the scatterplot above, it appears that there is a linear correlation between WLTP and NEDC-c figures. The trend line even suggests this. However, the WLTP:NEDC-c ratio actually ranges from 0.94 to 1.40 (i.e. -6% to +40%) and will invariably continue to widen further as data for more models is released. Furthermore, although the deviation ranges from 0.94 to 1.4, our analysis has revealed that, paradoxically, lower emissions cars typically have higher deviations whereas some cars with high power output even record lower emissions figures under WLTP than NEDC-c. We refer to this phenomenon as the ′WLTP Power Paradox.’ The scatterplot below highlights this trend as you can see that the deviation diminishes the higher the NEDC-c emissions figure, as per the trend line.
Figure 2: NEDC-c emissions figures, CO2 g/km, and WLTP:NEDC-c deviation (%)
The deviation varies between cars because the WLTP test cycle has a different energy demand to NEDC, and vehicles respond differently to the test requirements. Many cars are already subject to higher registration taxes in certain markets as their NEDC-c values (based upon the results of WLTP testing) are higher than the figures previously reported under NEDC testing. The increase is typically between 5%-10%, which opens up the possibility of thousands of buyers paying a tax penalty by stealth.
Plug-in hybrid models have been adversely affected as the effect of the fully-charged electric battery has been reduced, pushing crucial CO2 emissions figures above 50g/km. Consequently, some vehicle manufacturers who offer plug-in hybrid electric vehicles are halting sales of the models in Europe in the wake of the introduction of WLTP compliance on 1 September.
The impact on tax liabilities would be even greater if countries with emissions-based tax regimes switched to using WLTP emissions figures, given the higher deviation than between NEDC-c and NEDC figures. Autovista Group has conducted analysis that highlights the additional taxes that will be levied on new cars in the EU5 markets if they were to simply switch to using WLTP emissions figures.